G02 · Functions & Cartesian PlaneOpen in Studio
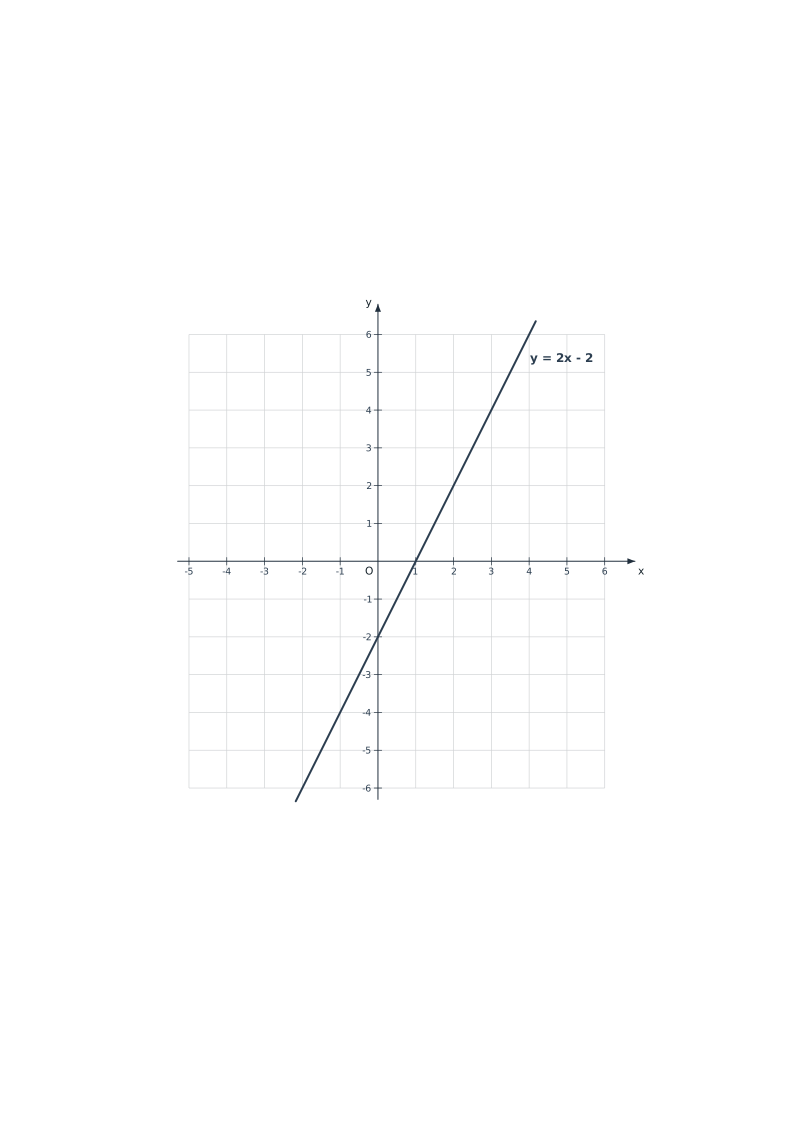
y = 2x − 2 · (m = 2, q = −2)SVG · PPTX · ISO 1:1
G02 // RETTA_CRESCENTE_2X_MENO_2
Linear Function Graph (y = 2x − 2)
y = 2x − 2 · (m = 2, q = −2)
Editorial vector mathematical diagram of Linear Function Graph (y = 2x − 2) (y = 2x − 2 · (m = 2, q = −2)) ready for school worksheets, exams, and lessons. Open with exact measurements in TypeMath Studio, download in pure SVG or 100% editable PowerPoint & Office PPTX, including text.
SVGPPTXPOWERPOINT & MICROSOFT OFFICE
Downloadable as pure .SVG vector graphics and 100% editable in PowerPoint & the entire Microsoft Office suite (.PPTX), including all text labels and dimensions.
Measurements & parameters pre-loaded in Studio
M=2Q=-2X_MIN=-5X_MAX=6Y_MIN=-6Y_MAX=6STEP_X=1STEP_Y=1U_CM=1TICK_STEP_X=1TICK_STEP_Y=1
More Functions & Cartesian Plane Figures
G02 · y = −0.5x + 3 · (m = −1/2, q = 3)
Decreasing Linear Function (y = −0.5x + 3)
G02 · y = 0.5x − 1 · (m = 0.5, q = −1)
Line on Millimeter Grid (y = 0.5x − 1)
G02 · y = −x · (m = −1, q = 0)
Second & Fourth Quadrant Bisector (y = −x)
G02 · y = x · (m = 1, q = 0)
First & Third Quadrant Bisector Line (y = x)
G05 · y = (1/2)ˣ · (a = 0.5)
Exponential Decay Function y = (0.5)ˣ
G01 · [-4, 4] · unità 1.5 cm · millimetrato