G03 · Functions & Cartesian PlaneOpen in Studio
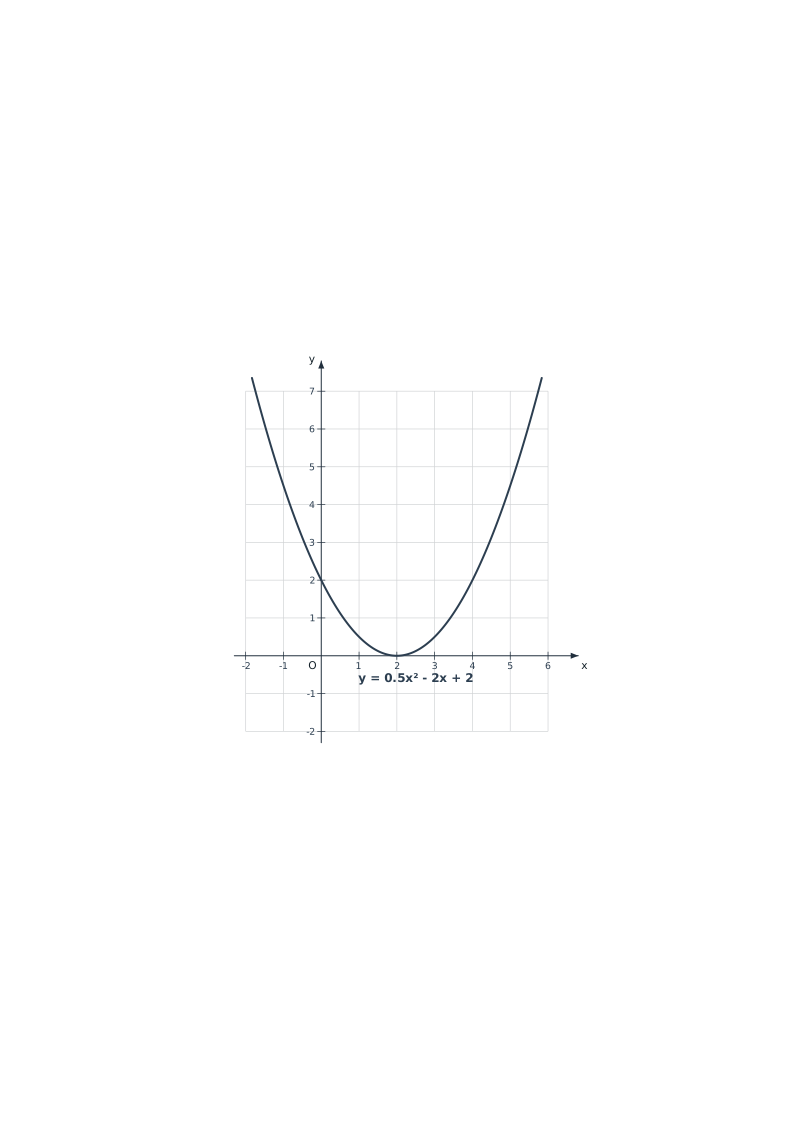
y = 0.5x² − 2x + 2 · Δ = 0SVG · PPTX · ISO 1:1
G03 // PARABOLA_TANGENTE_ASSE_X
Parabola Tangent to X-Axis (Δ = 0)
y = 0.5x² − 2x + 2 · Δ = 0
Editorial vector mathematical diagram of Parabola Tangent to X-Axis (Δ = 0) (y = 0.5x² − 2x + 2 · Δ = 0) ready for school worksheets, exams, and lessons. Open with exact measurements in TypeMath Studio, download in pure SVG or 100% editable PowerPoint & Office PPTX, including text.
SVGPPTXPOWERPOINT & MICROSOFT OFFICE
Downloadable as pure .SVG vector graphics and 100% editable in PowerPoint & the entire Microsoft Office suite (.PPTX), including all text labels and dimensions.
Measurements & parameters pre-loaded in Studio
COEFF_A=0.5COEFF_B=-2COEFF_C=2SHOW_FOCUS=trueX_MIN=-2X_MAX=6Y_MIN=-2Y_MAX=7STEP_X=1STEP_Y=1U_CM=1TICK_STEP_X=1TICK_STEP_Y=1
More Functions & Cartesian Plane Figures
G03 · y = 0.25x² − 3 · fuoco e direttrice
Wide Parabola with Focus & Directrix (y = 0.25x² − 3)
G03 · y = x² · grafico muto
Unlabeled Exam Parabola (y = x² · grafico muto)
G03 · y = x² − 4x + 3 · V(2, −1)
Parabola with Real Roots x = 1, 3 (y = x² − 4x + 3)
G03 · y = −x² + 4 · V(0, 4)
Downward Opening Parabola (y = −x² + 4)
G01 · [-8, 8] · muto senza numeri
Blank Unnumbered Cartesian Grid [-8, 8]
G02 · y = 2x · con equazione