G03 // PARABOLA_X2_PIU_2X_MENO_3_MUTA
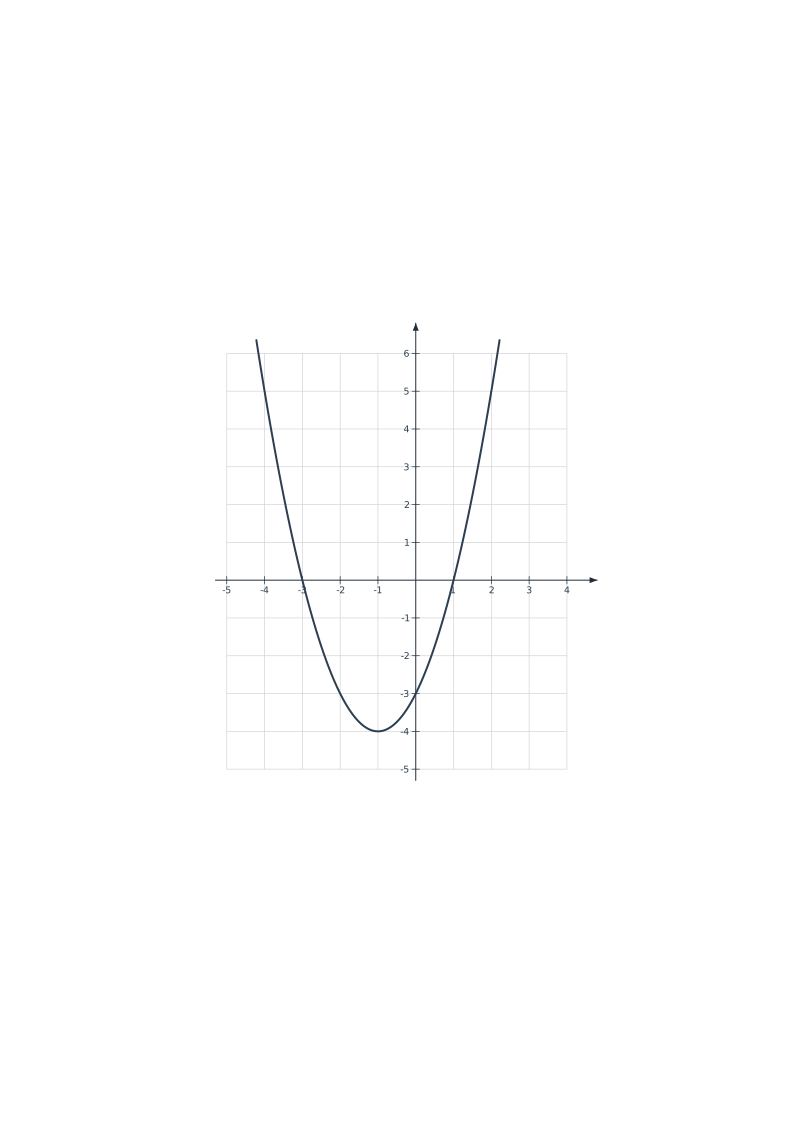
Unlabeled Exam Graph: Parabola y = x² + 2x - 3 (Roots -3 and 1)
Editorial vector mathematical diagram of Unlabeled Exam Graph: Parabola y = x² + 2x - 3 (Roots -3 and 1) (y = x² + 2x - 3 · zeri -3 e 1 · senza equazione) ready for school worksheets, exams, and lessons. Open with exact measurements in TypeMath Studio, download in pure SVG or 100% editable PowerPoint & Office PPTX, including text.
Downloadable as pure .SVG vector graphics and 100% editable in PowerPoint & the entire Microsoft Office suite (.PPTX), including all text labels and dimensions.
More Functions & Cartesian Plane Figures
G03 · y = -0.5x² + 2x + 2 · V(2,4)
Projectile Trajectory Parabola y = -0.5x² + 2x + 2
G03 · y = -0.5x² + 2x + 2 · V(2,4) · senza equazione
Unlabeled Exam Graph: Projectile Trajectory Parabola y = -0.5x² + 2x + 2
G03 · y = x² + 2x - 3 · zeri -3 e 1
Parabola y = x² + 2x - 3 (Roots -3 and 1)
G03 · y = 2x² - 4x · per l'origine · senza equazione
Unlabeled Exam Graph: Parabola Through Origin y = 2x² - 4x
G04 · xy = -4 · II e IV quadrante
Equilateral Hyperbola y = -4/x in Quadrants II & IV
G05 · y = (1/3)ˣ · decadimento rapido